Direct mail cut-through in Australia has never been higher, partly because consumer and business inboxes have never been noisier. Marketers reaching Australian audiences with physical postcards, letters, and catalogues are seeing response rates that digital campaigns rarely approach. This guide brings together the 2026 benchmarks by format and industry, works through the cost-per-response maths in a real example, and covers the levers most likely to push your results above the average.
- Overall direct mail response rates typically fall in the 2-5% range; existing customer (house) lists routinely reach 5-9%.
- Postcards are among the best-performing individual formats, with well-targeted campaigns commonly landing in the 4-6% band.
- Direct mail outperforms email response rates by roughly 5-10x on a like-for-like audience.
- Each percentage point of lift in response rate has a significant effect on cost-per-response, particularly on shorter runs of 500-2,000 pieces.
- The highest-impact levers are list quality, personalisation, and offer strength, in roughly that order.
- Seasonality matters: Q4 (October to December) consistently delivers the strongest response in Australian consumer sectors.
The 2026 Australian Direct Mail Benchmark Table
Industry benchmarks used by Australian marketers draw primarily from ANA/DMA research (the most comprehensive longitudinal dataset for the direct mail channel) and aggregated campaign data from global operators running programmes in Australia. There is limited Australia-only published data, but marketers in mature markets such as Australia, the UK, and Canada consistently use these global bands as planning norms, layering in their own historical results where available.
| Campaign type | Typical response rate | Notes |
|---|---|---|
| House list (existing customers) | 5-9% | Loyalty, reactivation, and upsell campaigns to known customers |
| Targeted prospect list | 2-4% | Well-segmented cold lists; varies by sector and offer strength |
| Triggered mail (new movers, life events) | 8-14% | High relevance plus right timing drives the strongest results |
| Unaddressed (suburb/postcode drops) | 1-2% | Lowest response but also lowest cost-per-piece; a volume play |
| Campaign with strong premium offer or gift incentive | up to 10-14% | A compelling incentive significantly raises the response ceiling |
| All direct mail campaigns (overall average) | 3-5% | Blended average across formats, list types, and industries |
These ranges reflect typical campaign performance. Your actual result will sit higher or lower depending on list quality, format, offer, and timing, all of which are covered in the levers section below.
How Direct Mail Compares to Digital Channels
The case for including direct mail in an Australian marketing mix often comes down to this comparison. The response-rate advantage is substantial, though the channels serve different roles in a customer journey.
| Channel | Typical response / action rate | What the metric captures |
|---|---|---|
| Direct mail (all formats) | 3-5% | Physical response: call, visit, scan, redemption |
| Email marketing | 0.1-0.6% | Click-through rate; open rates are 20-40% but actions are much lower |
| Paid social (Facebook, Instagram) | 0.5-1.5% | CTR; varies heavily by audience, creative, and objective |
| Display / banner advertising | 0.05-0.1% | CTR; significant ad-blindness effect on most placements |
| Search (Google Ads, high intent) | 2-6% | CTR on top-of-page results; depends heavily on keyword intent |
Direct mail does not beat search on intent alignment, and for B2B research-driven purchases, email still has a role. But direct mail outperforms almost every other channel on response rate and recall. A postcard sitting on someone’s kitchen bench is not competing with 200 other messages in the same moment.
Response Rates by Format
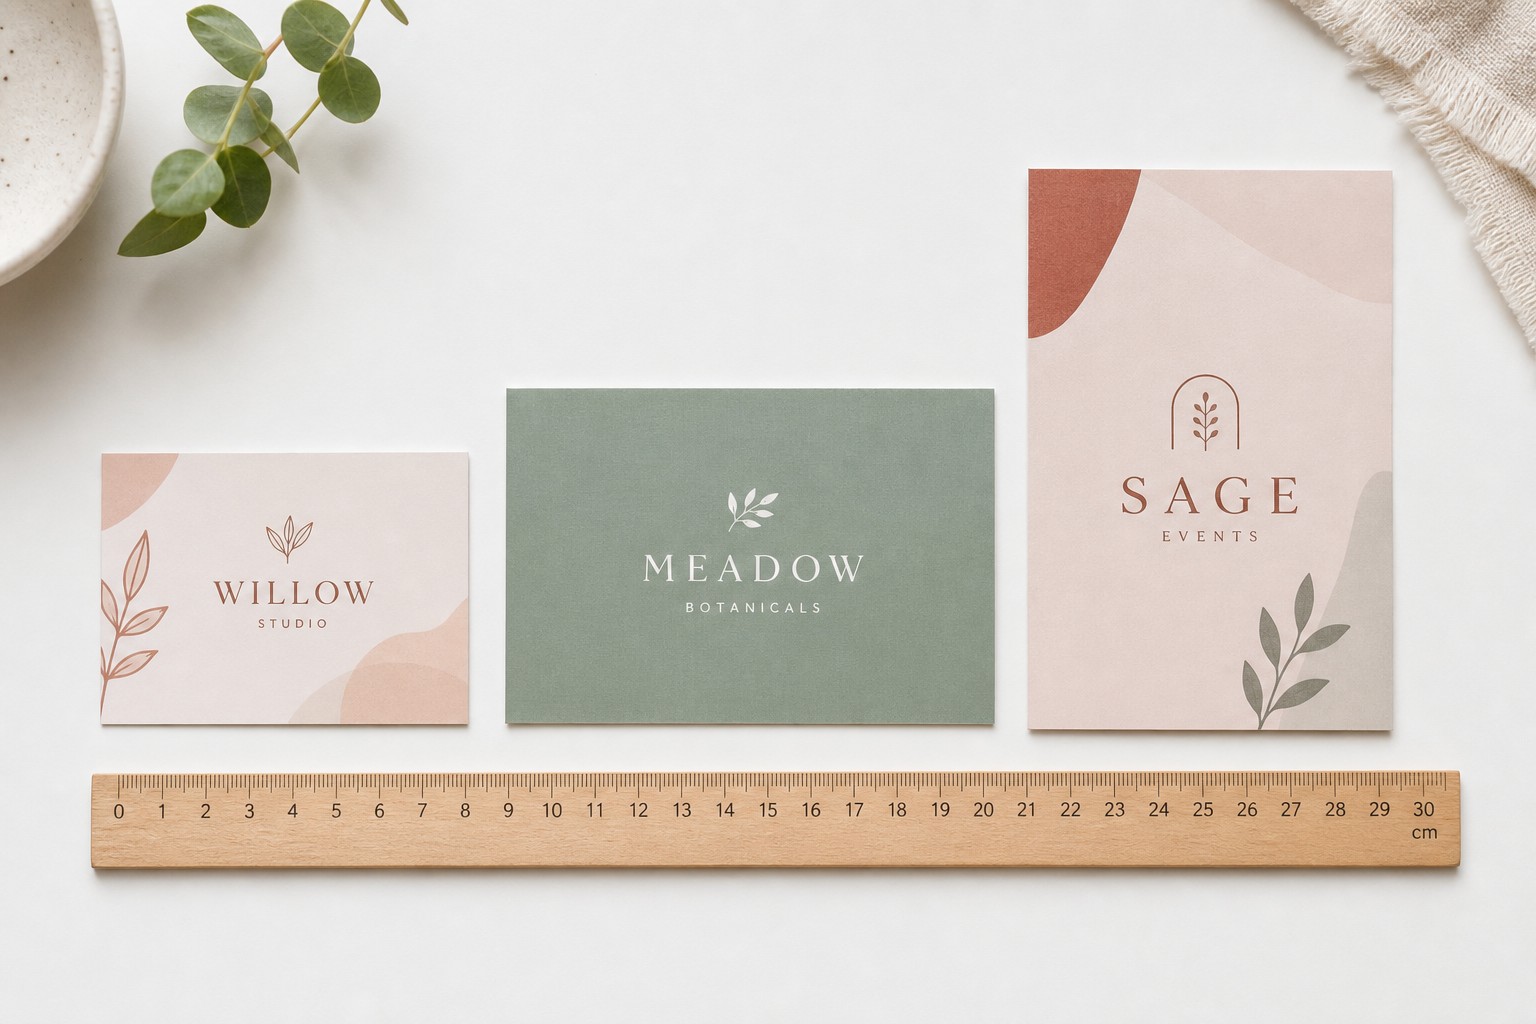
Not all direct mail formats perform equally. The piece you choose affects how much attention it gets in the letterbox, whether it qualifies for AusPost addressed mail rates, and what response rate you can realistically model.
| Format | Typical response range | Best suited for |
|---|---|---|
| Postcard (A5 / 148 x 210 mm) | 4-6% | Retail offers, event invitations, loyalty campaigns, real estate |
| Postcard (A6 / 105 x 148 mm) | 3-5% | High-volume coupon drops, appointment reminders, short offers |
| DL postcard (99 x 210 mm) | 3-5% | Event announcements, coupons, pieces that need to fit a DL envelope |
| Letter in envelope | 3-5% | B2B, financial services, healthcare, higher-consideration purchases |
| Catalogue or booklet | 2-5% | Product-heavy brands with a wide range; trade and retail |
| Unaddressed / suburb drop (flyer format) | 1-2% | Hyper-local awareness; new openings, local services, tight catchments |
Postcards consistently rank among the top-performing formats on a response-rate basis. There is no envelope to open, the message is immediately visible, and production costs are lower than a multi-piece letter pack. For businesses weighing format options, custom postcards in A5 or A6 offer the best balance of impact, cost, and operational simplicity. For volume awareness campaigns where postage cost is the primary driver, flyer printing on lighter stock can reduce per-piece spend significantly at 5,000-plus pieces.
The Cost-Per-Response Calculation
Response rate is a useful planning input, but the number that actually drives campaign decisions is cost-per-response (CPR). Here is how to work it through for a typical postcard campaign at 1,000 pieces.
Worked example: 1,000 A5 postcards, single addressed drop
- Print cost (1,000 units, full-colour both sides): use your actual quote from the postcard product page
- Postage (AusPost addressed mail): verify current rates at auspost.com.au for your piece’s size and weight class; as a rough planning figure, addressed letter rates for a standard-weight A5 piece at this volume typically fall in the $0.55-$0.80 per piece range
- Design (if applicable): a fixed cost that amortises across the full run
Using a combined campaign cost estimate of $900-$1,100 (print plus postage at this volume), here is how response rate moves the CPR:
| Response rate | Responses from 1,000 pieces | Approx. cost per response |
|---|---|---|
| 1% | 10 | $90-$110 |
| 2% | 20 | $45-$55 |
| 3% (typical cross-industry average) | 30 | $30-$37 |
| 5% | 50 | $18-$22 |
| 8% (house list with strong offer) | 80 | $11-$14 |
At a 3% response rate, a postcard campaign at this scale delivers responses in the $30-$37 range per enquiry. If your average customer lifetime value exceeds that threshold, the economics work. Scaling to 5,000 or 10,000 pieces typically reduces per-unit print and postage costs, compressing CPR further even without changing the response rate.
Seven Levers That Lift Response Rates
Response rates are not fixed inputs. These are the levers with the most reliable impact, in rough order of influence.
1. List quality and targeting
The single biggest predictor of response rate is who receives the piece. A well-segmented list, such as existing customers filtered by recency or postcode-matched prospects in your service catchment, will regularly outperform a broad cold list by 2-4x. Tighter targeting also means fewer pieces mailed and a lower total campaign cost, which improves CPR even as the volume shrinks.
2. Personalisation and variable data printing
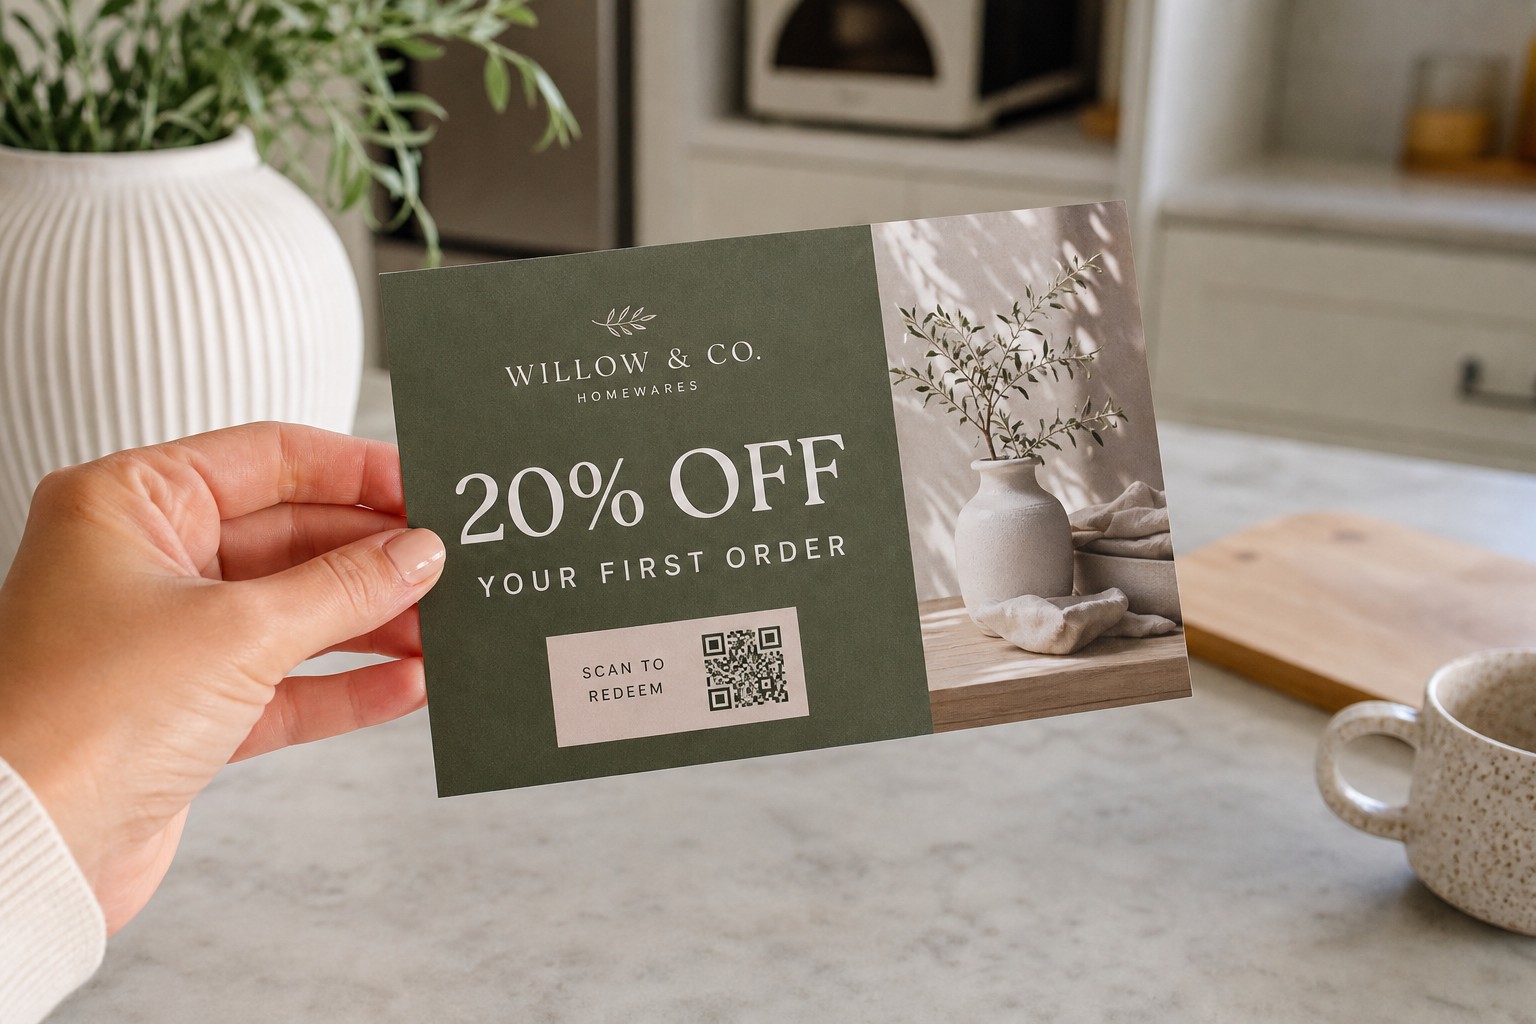
Addressed mail already outperforms suburb drops, but personalisation within the piece takes response further. Including the recipient’s name, referencing a past interaction, or varying the headline by suburb or business type can lift response by 30-100% over a static design. Variable data printing manages name fields, personalised QR codes, and address variations across a full run from a single print-ready file.
3. Offer strength
Australians respond to clarity and specific value. A postcard carrying a time-limited offer (“15% off your next booking, valid until 31 August”) consistently outperforms one that simply announces the business. The offer should be the first element visible when the piece lands in a hand or on a bench. Vague value propositions are the most common reason a campaign underperforms its format benchmark.
4. Format and physical size
Larger formats command more attention in the letterbox. An A5 postcard (148 x 210 mm) is noticed before an A6 (105 x 148 mm) and commands more reading time. For campaigns where impact justifies additional cost, a shaped or die-cut postcard stands out in a stack of standard rectangles, which makes it particularly useful for re-engagement or high-value prospect campaigns.
5. QR codes and trackable response mechanisms
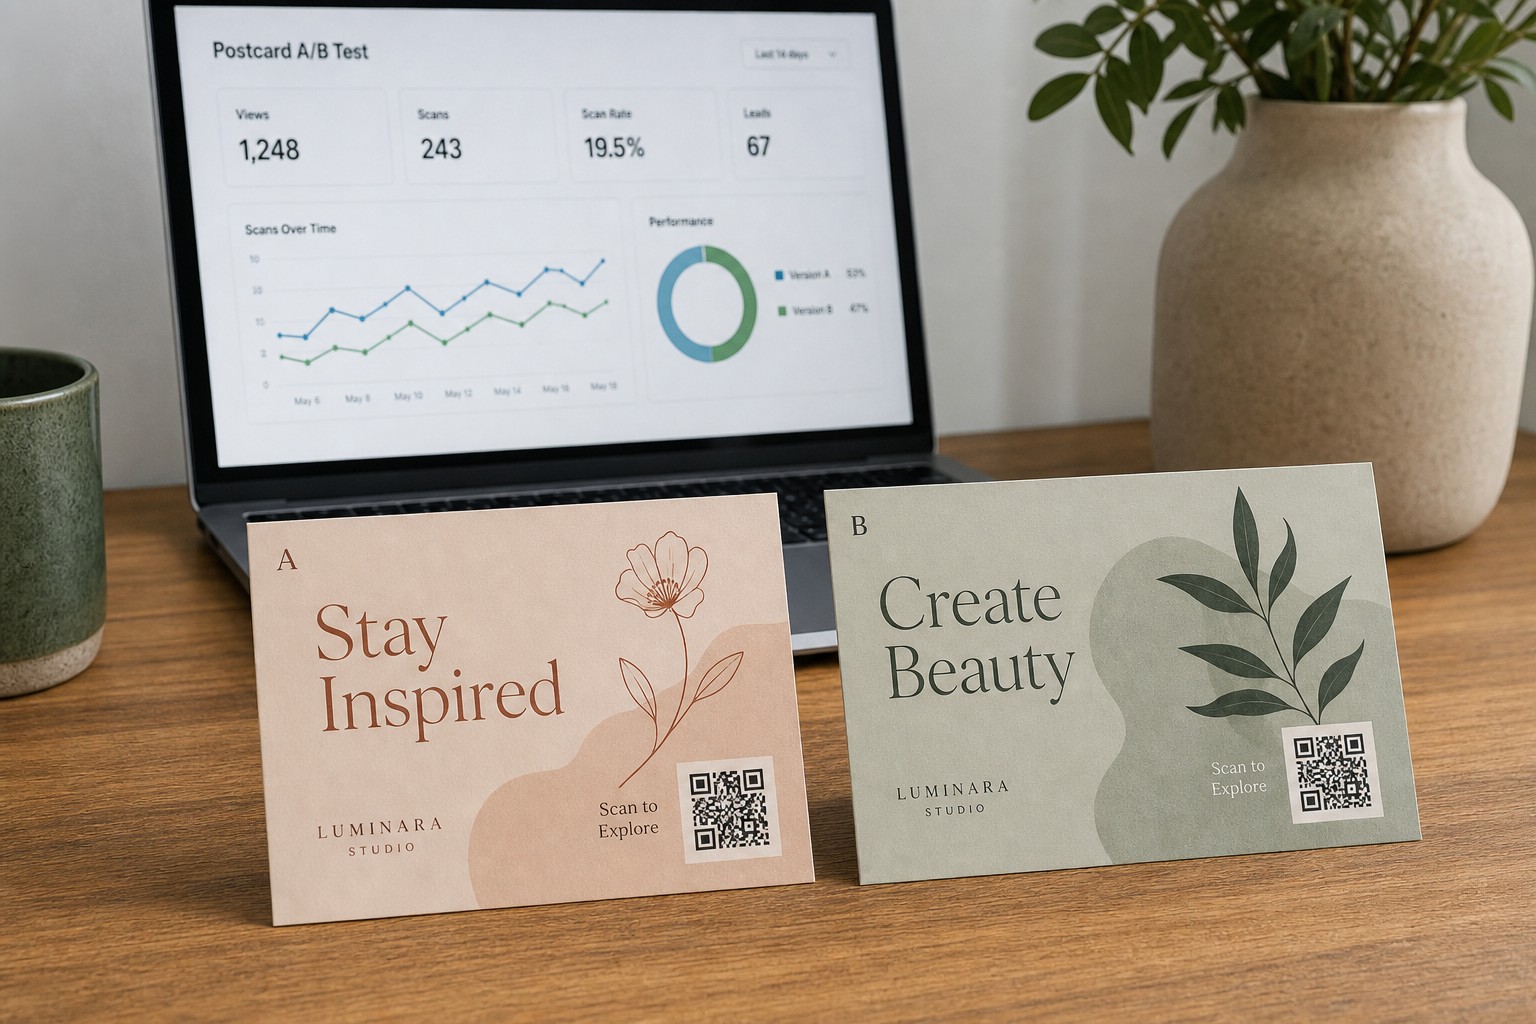
QR codes address the measurement problem that has historically made direct mail harder to justify in a digital-first budget conversation. Each unique QR code, dedicated URL, or promo code lets you attribute web sessions, form completions, and calls directly back to the campaign. If you are mailing different audience segments or testing two creative variations, separate QR codes per variant give you clean response data within days of the drop landing, without needing phone-tracking or post-campaign surveys.
6. Timing and seasonality
Consumer response rates in Australian B2C categories tend to peak in Q4, particularly October to December. B2B response is typically stronger in February-March and August-September, when planning cycles are active. Mailing into a period when your audience is already in buying mode, rather than at a quieter time of year, can shift response by a full percentage point without changing anything else about the campaign.
7. Design and call to action
A postcard with one clear call to action (CTA) outperforms one with three. The CTA should answer three questions at a glance: what do I do, why now, and how? A physical deadline, a single next step (“scan to book” or “call to claim”), and a design hierarchy that leads the eye to both the offer and the CTA are consistent features of high-performing pieces. White space and legibility at a glance matter more than design complexity.
Related Reading
These posts cover adjacent topics and are worth reading alongside this one:
- Direct Mail Postcards for Australian Small Business – campaign planning, budget tiers, AusPost targeting options, and compliance
- Postcard vs Flyer Printing: Which Format Works Harder? – format comparison including AusPost mail eligibility and per-unit cost breakdown
- Variable Data Postcard Printing in Australia – full VDP workflow, technical file preparation, and privacy compliance
Frequently Asked Questions
What is a good direct mail response rate in Australia?
A commonly cited average across all direct mail formats is 3-5%, with ANA/DMA benchmarks putting the blended average at around 4.4% across all campaign types. In practice, campaigns mailing to an existing customer list routinely land in the 5-9% range, while cold prospect campaigns typically see 2-4%. What counts as good depends on your customer lifetime value and your target cost-per-response.
Do postcards perform better than letters for direct mail campaigns?
Postcards tend to generate higher response rates than standard letter-in-envelope campaigns for most consumer categories, partly because there is no envelope to open and the message is immediately visible. Industry benchmark data consistently places postcards among the top-performing formats. For high-consideration B2B purchases or financial services, a letter in an envelope can perform better because the format signals a more formal, personalised communication.
How do I track the response rate from a direct mail campaign?
The most reliable methods are unique QR codes coded to a specific campaign or audience segment, dedicated landing page URLs, and unique promotional codes. These allow you to attribute web sessions, calls, and form completions directly back to the mail drop with reasonable precision. Variable data printing makes it straightforward to assign a unique QR code or URL to every piece in a run, giving you per-segment response data.
Why do response rates vary so much between campaigns?
List quality is the biggest single driver of variance. A campaign mailing to well-targeted, recency-filtered existing customers can return 5-9%, while a broad cold list with a generic offer may return under 1%. Offer strength, format, timing, and creative quality each contribute, but none of them fully compensates for a poorly targeted or stale mailing list.
Is direct mail still cost-effective compared to digital advertising?
It depends on what you are optimising for. At a 3% response rate on a 1,000-piece postcard run, cost-per-response typically falls in the $30-$37 range. That competes well with mid-funnel digital advertising for many local service and B2C categories. The case for direct mail is often strongest in combination: a physical postcard arriving in the same week as a retargeting ad reinforces the message and tends to lift conversion rates on both channels.
What postcard sizes are available for direct mail campaigns?
Paperlust Print Shop produces postcards in A6 (105 x 148 mm), A5 (148 x 210 mm), and DL (99 x 210 mm). A5 is the most popular format for campaigns where making an impression is the priority; A6 suits higher-volume coupon and reminder drops; DL fits standard envelope windows for hybrid addressed-mail campaigns. Die-cut shapes and custom sizes are also available.